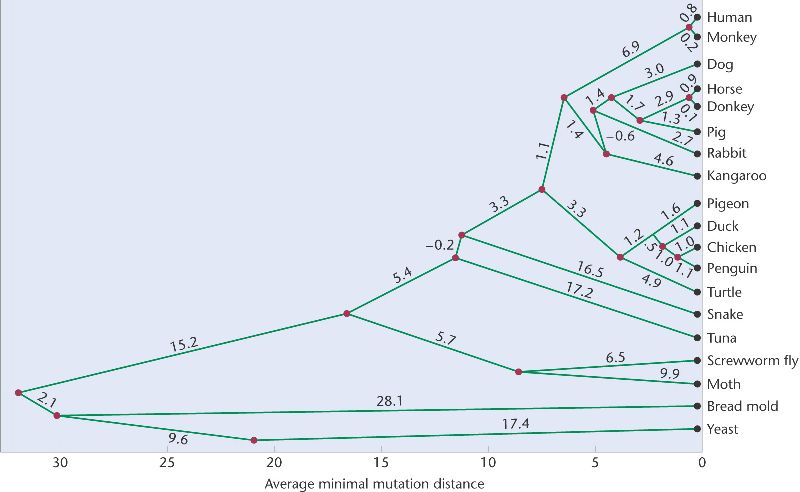
Fitch used data on the minimal mutational distances between the cytochrome c genes of 19 organisms to reconstruct their evolutionary history. The result is an estimate of the evolutionary tree, or phylogeny, that unites the species (Figure 26-18). The black dots on the tips of the twigs represent the extant species, which are connected to the inferred common ancestors represented by red dots. The ancestral species evolved and diverged to produce the modern species. The common ancestors are connected to still earlier common ancestors, culminating in a single common ancestor for all the species on the tree, represented by the red dot on the extreme left.
Figure 26-18. Phylogeny constructed by comparing homologies in cytochrome c amino acid sequences. (This item is displayed on page 654 in the print version) [View full size image]